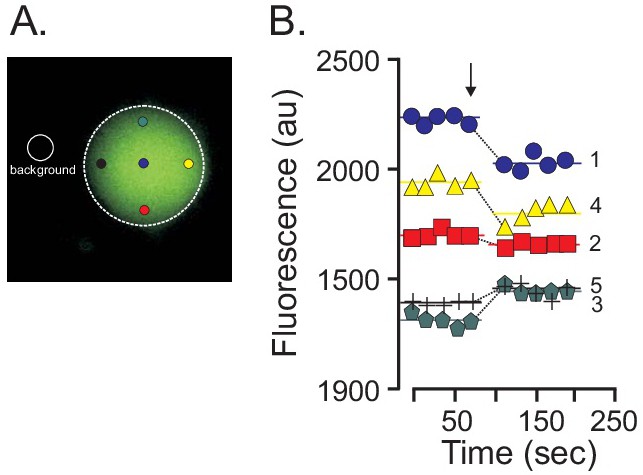
Fig. 2. Calcein fluorescence measurements in dorsal root ganglion neurons. A, Micrograph image taken on a widefield microscope, showing an isolated neuron loaded with calcein and background surrounding signal. Colored circles provide the position of the small "pinholes" that were used to acquire fluorescent signal during the swelling phase of the neuron during a hypotonic treatment. B, Hypotonic stress was applied at the three minute mark (arrow in figure), variability of signals with only blue and yellow pinholes showing anticipated decrease in fluorescence, whereas no fluorescence or even increased fluorescence were observed at the red and green pinholes, respectively.